vroom 🏎️💨
vroom is an open source candlestick charting library that runs on iOS and Android via React Native and web via WASM beneath a React wrapper. The mobile and web implementation share a single C++ rendering core built on Skia, so charts stay smooth under pans, pinches, and live updates.
| Mobile (iOS) | Web/Desktop |
|---|---|
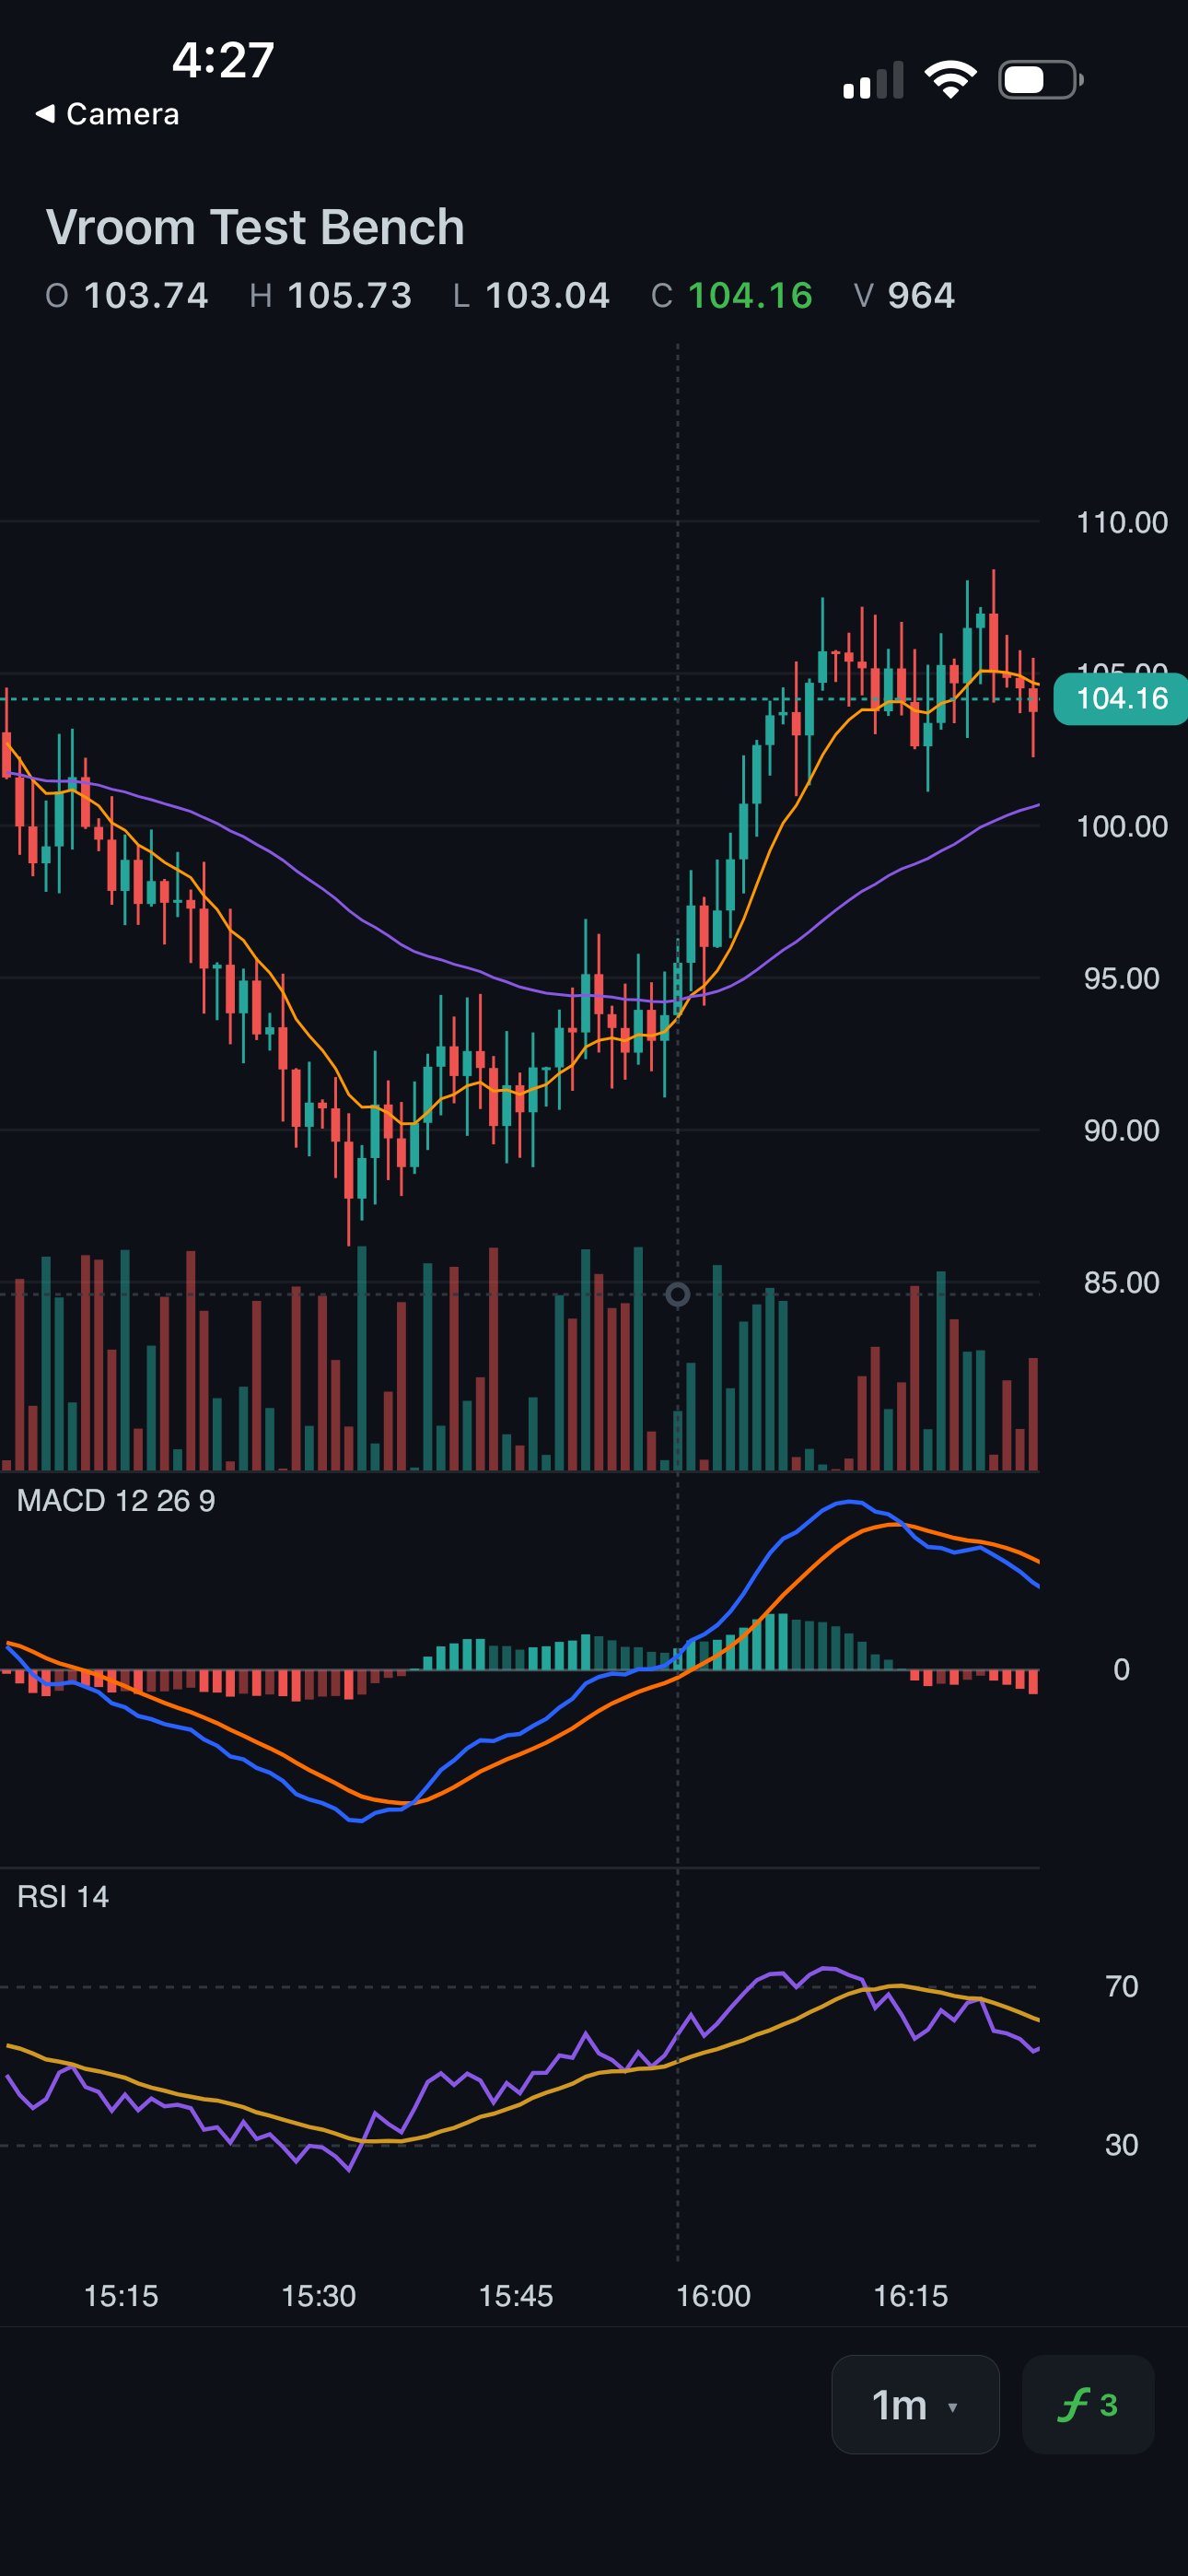 | 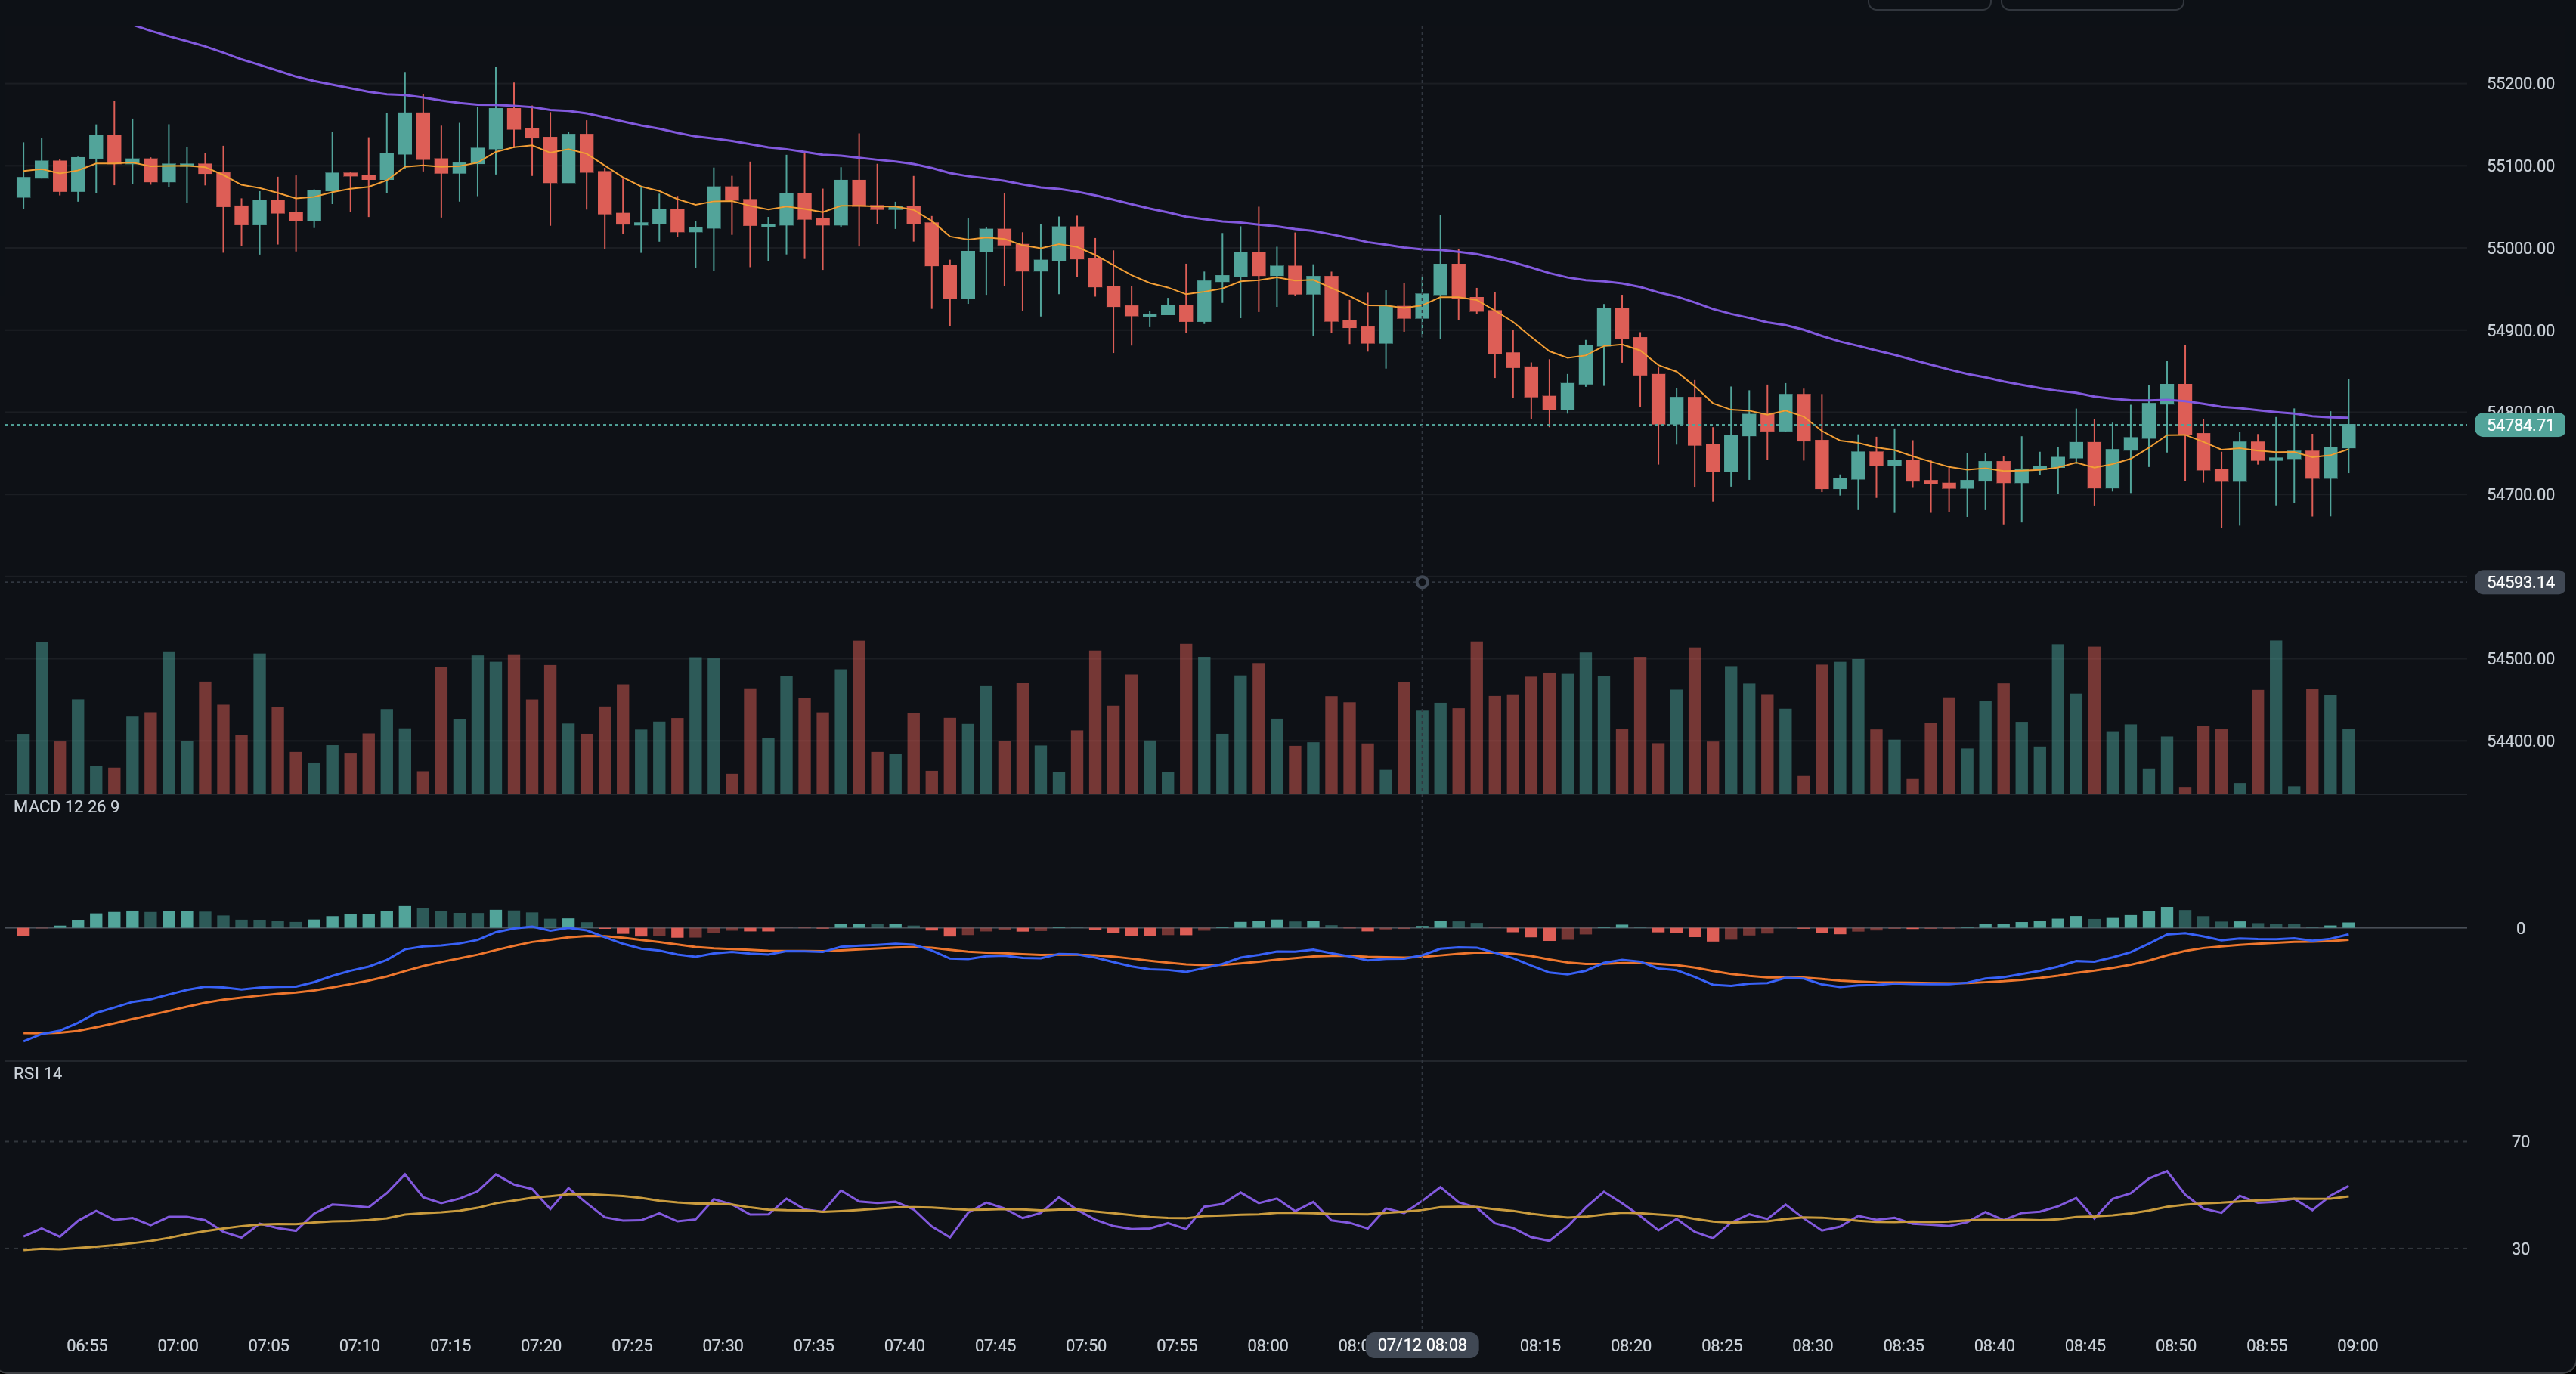 |
vroom currently supports 5 technical analysis indicators: RSI, VWAP, EMA, SMA, MACD and volume with more to come.
NOTE: native iOS and Android wrappers are in progress. Building the chart core in C++/Skia means it can and will be truly cross-platform.
Features
Candles, Volume and Indicators
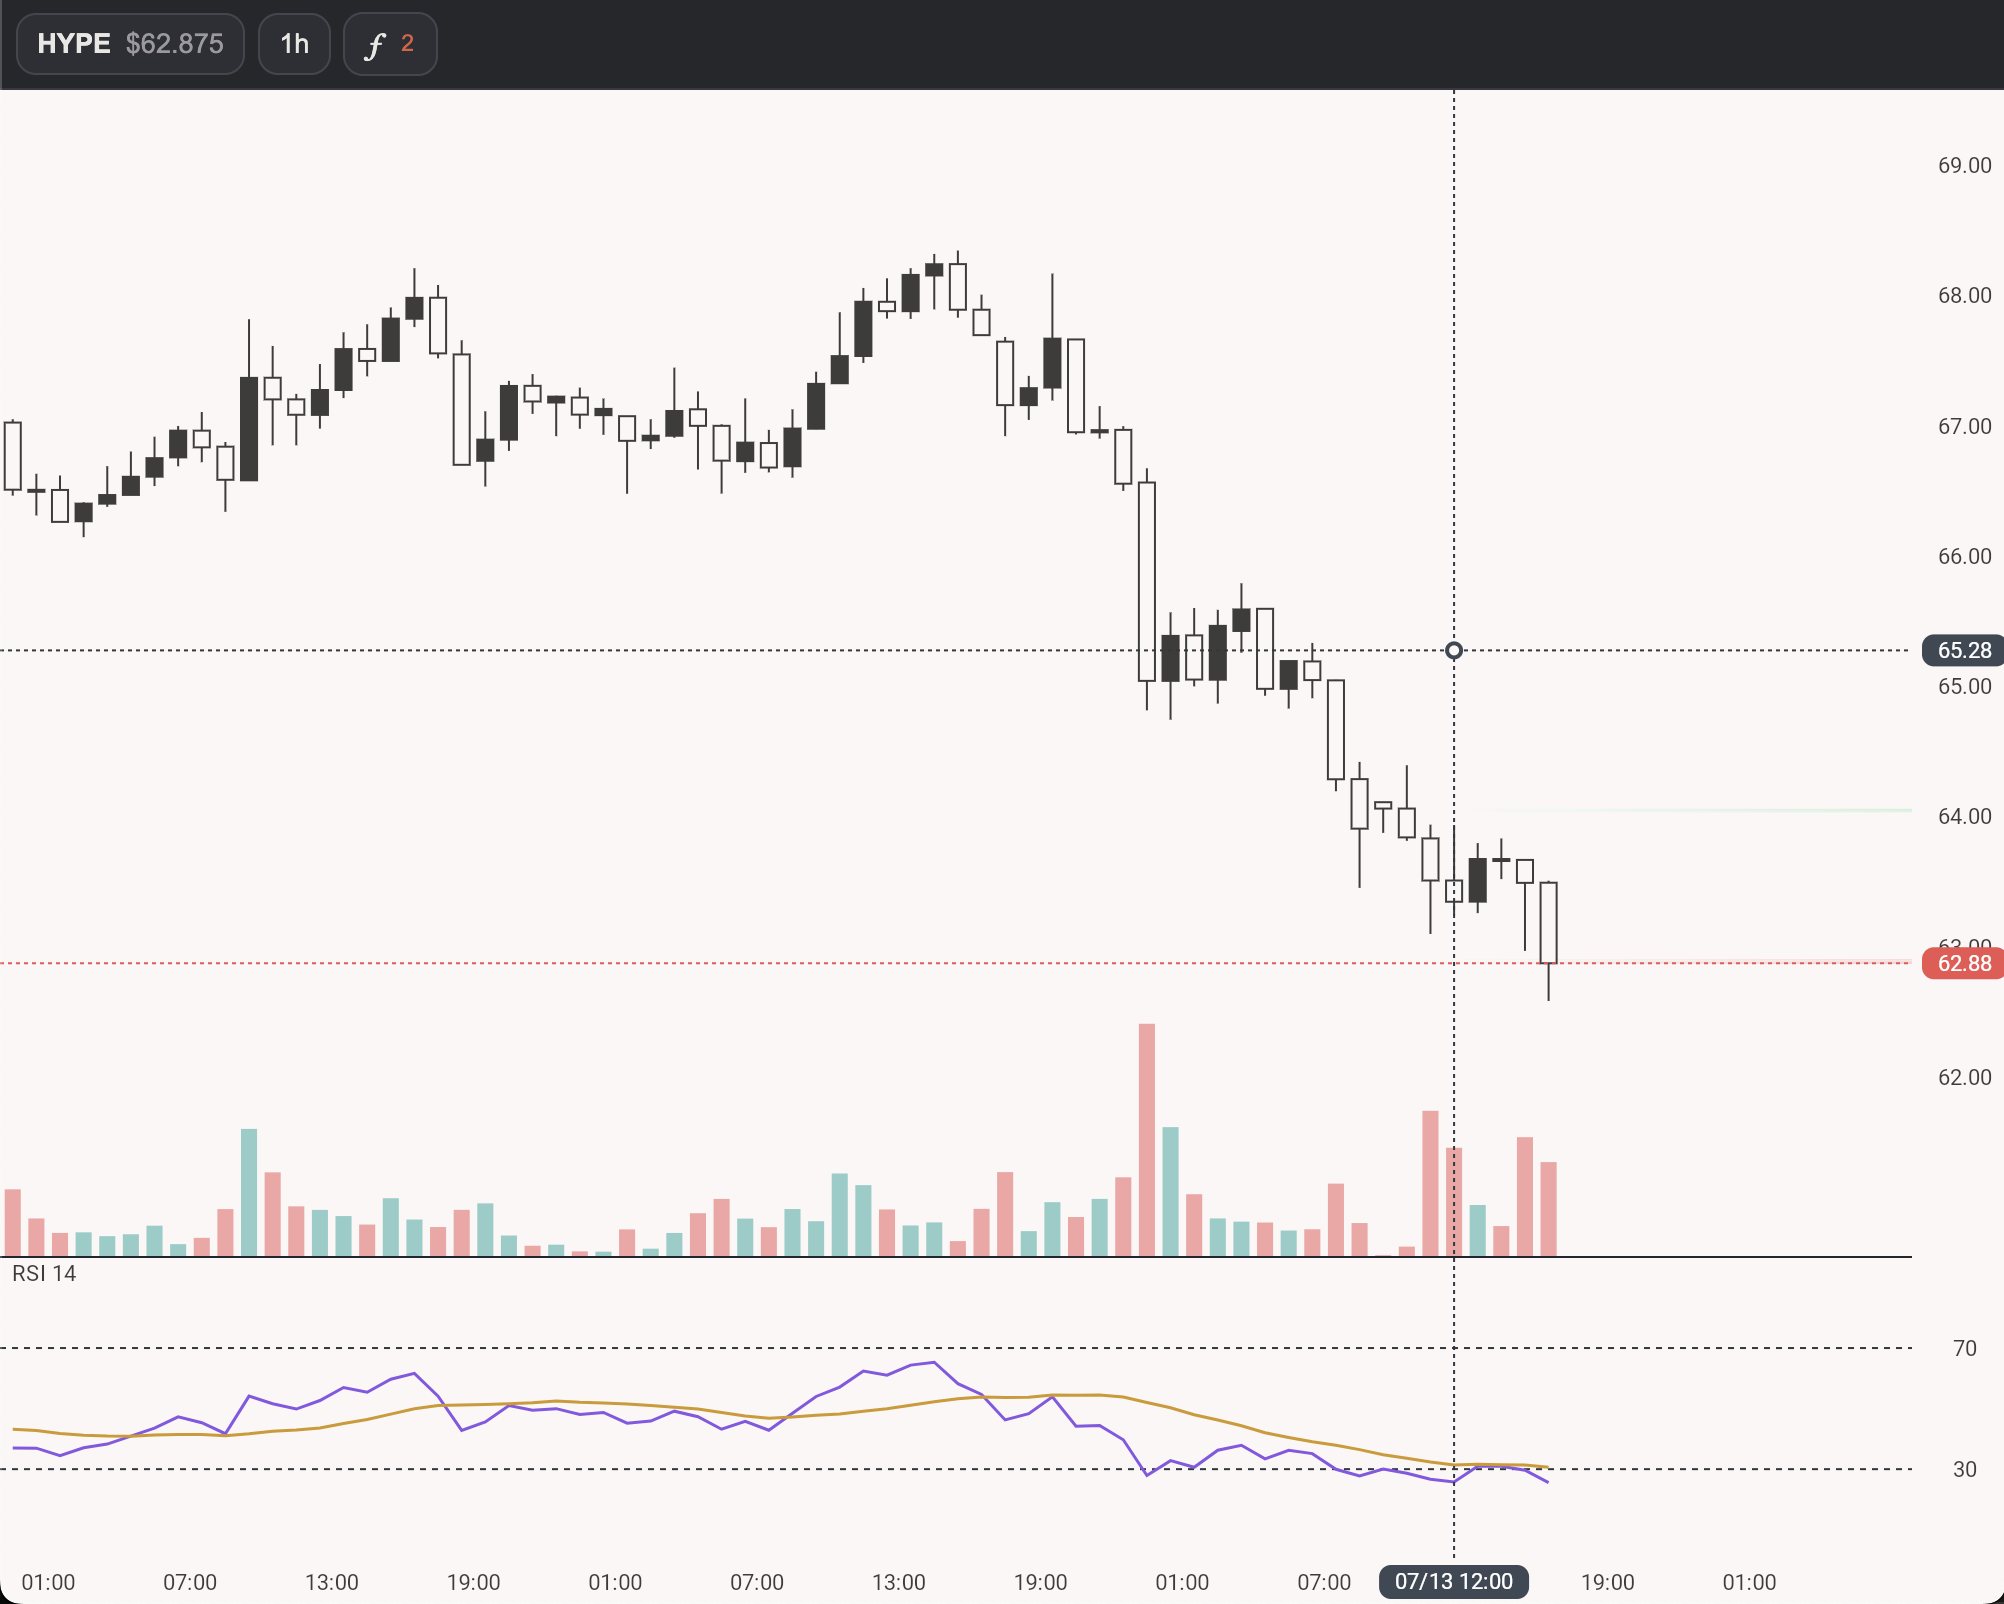
Candlesticks and volume render by default. Chart colors, candle styling (wick width, rounded bodies and wicks, rounded volume bars), the initial candle width, indicator visibility and parameters are all configurable through the theme and prop surface. vroom does not (currently) offer chart chrome/toolbars to customize the chart and its indicators. This is done by the consuming app so you can have full control of the look feel of your product.
Gestures
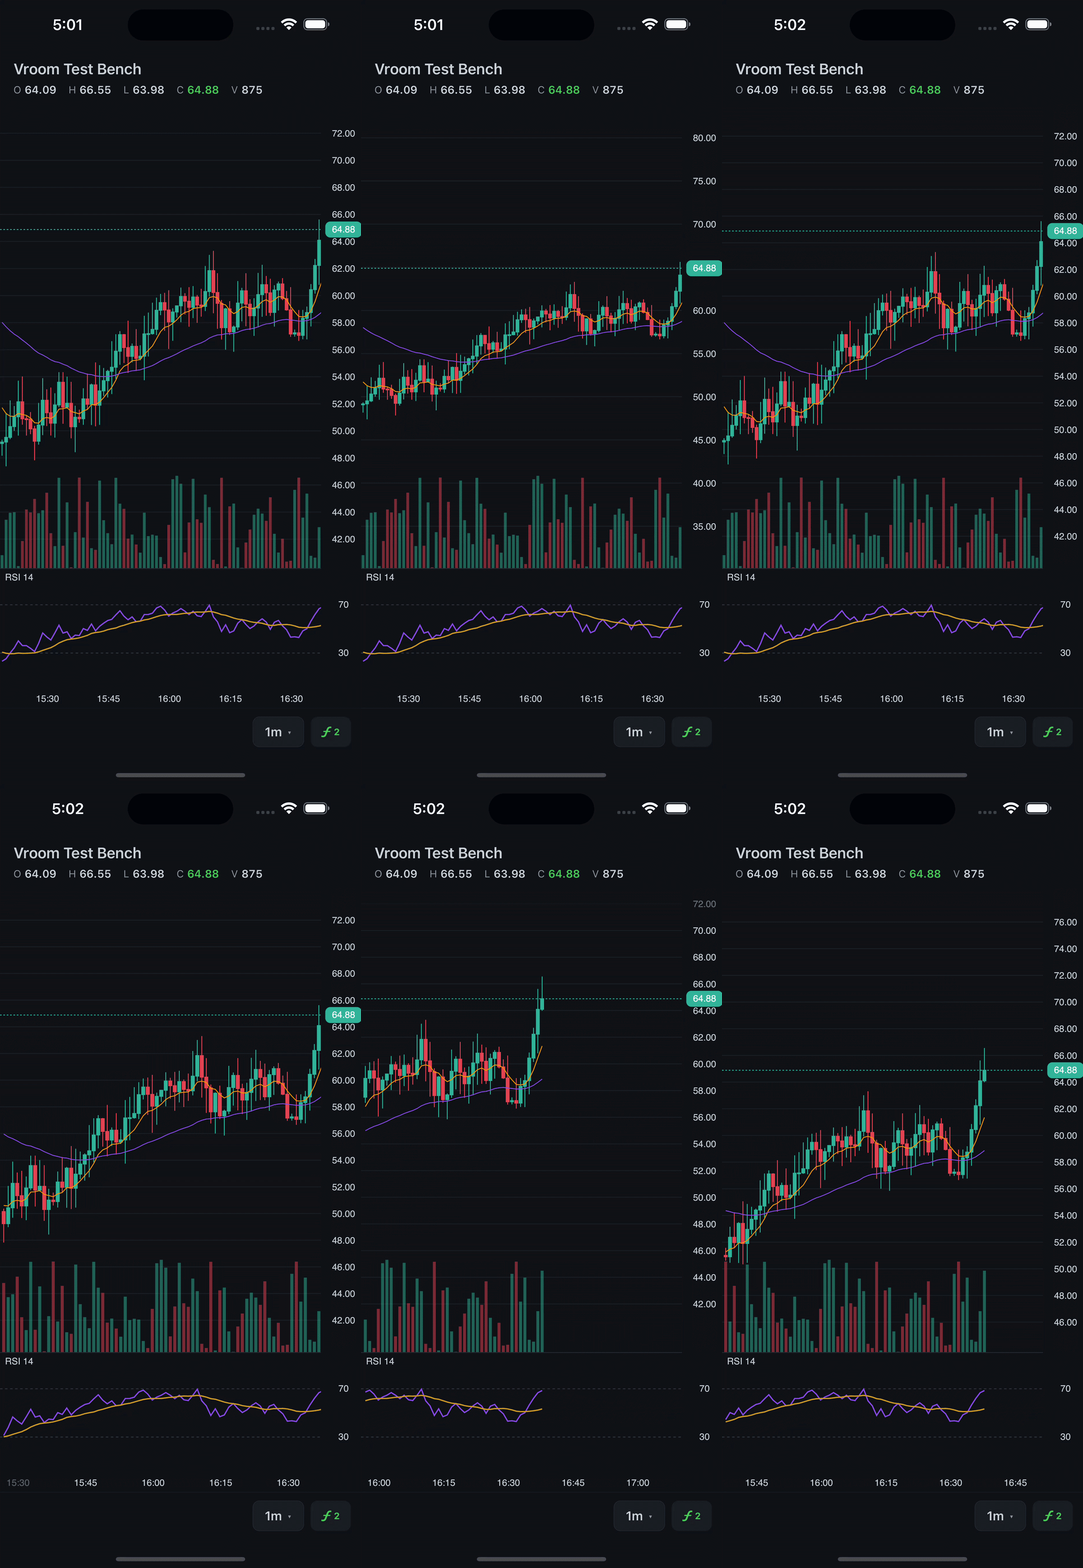
Navigating the chart feels natural and performs at 60+ FPS across all interactions.
The chart crosshair surfaces chart level data so the host app can render OHLCV data and fire haptics.
function Chart({ candles }) {
  return (
    <VroomChart
      candles={candles}
      onCrosshair={(e: CrosshairEvent) => {
        // e.reason → 'hide' || 'show'
        // e.timeMs → // crosshair datetime
        // e.candle → { open, high, low, close, volume } for your OHLCV readout
      }}
    />
  );
}
Drawing tools
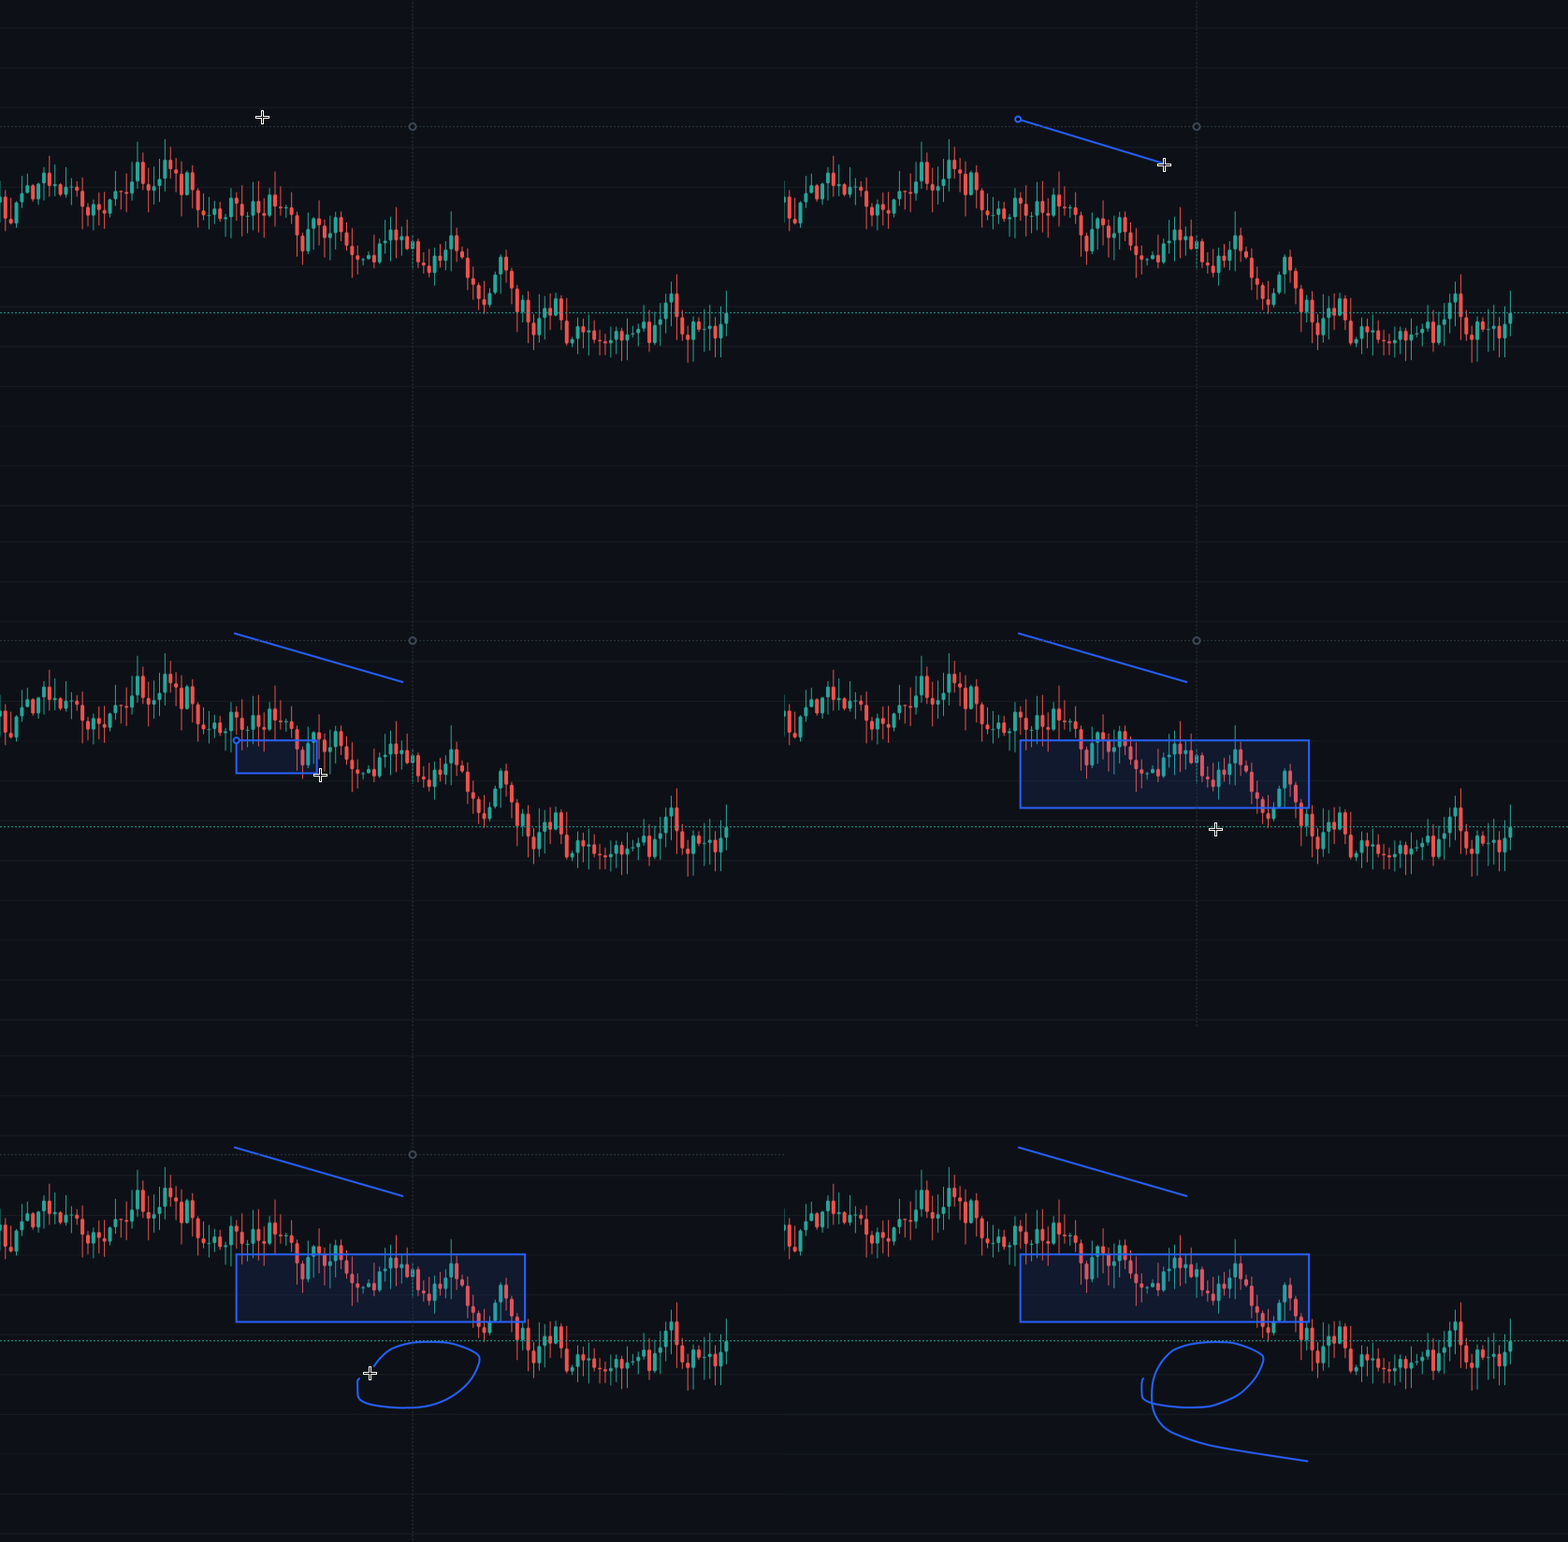
Vroom supports trendlines, rectangles and freehand pencil drawing, with full undo/redo (⌘Z / ⇧⌘Z, one step per committed drawing). Drawings are persisted via an injected local storage adapter and are indexed by asset/market so the drawings are maintained across refreshes.
Get started
- Installation — packages and peer dependencies for each platform.
- Quickstart — render your first chart.
- API reference